Secular Outlook
long term, cycle, forecast, human, life
Looking at financial markets every day may bring to wrong conclusions and to unwanted surprises. That’s the reason why I started investigating long term charts and discovered that in markets, as well as in every other aspects of human life, there are cycles.
Starting from the oldest American index, the Dow Jones Industrial Average, and applying the Elliott Wave approach what is easy to spot, at least in my personal opinion, is an impulsive structure where the 2013 high will be labeled as top of wave 3.
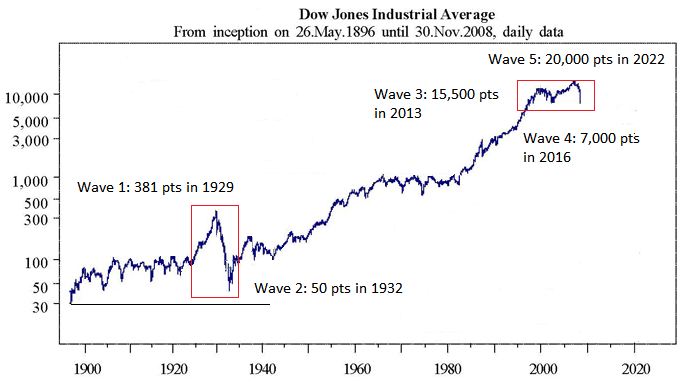
If this structure will be confirmed, then some assumptions are possible:
- - Wave 1 is from 1890 to 1929: behavior of this wave is mainly not volatile but long in time
- - Wave 2 from 1929 to 1932: behavior of this wave is sudden, violent and very deep without anyway breaking previous historical low
- - Wave 3 is from 1932 to 2013: behaviour of this wave is strong, long in time with a long correction period from 1955 (basically the end of the post-war period) to 1980 before starting an impressive bullish leg up.
If that is correct, it is possible to draw some assumptions to the coming wave 4 and 5.
From the law of alternation by Elliott, if wave 2 has been violent and deep and short in time, wave 4 will be long, tiring and shallow, at least compared to wave 2.
This can be already seen as from the year 2000 the index is inserted in a fairly wide sideways movement, with July 2013 breaking marginally previous highs.
If this high is top of wave 3, then we will experience in the coming years a complete set of a bearish three waves structure ABC which from this high will drive the index to previous low or even probably lower lows.
A conservative target will be seeing the Dow back to 7,000 points but a more aggressive outlook would target the low at around 4,500 points.
A time target for the completion of this ABC corrective structure is around 2016.
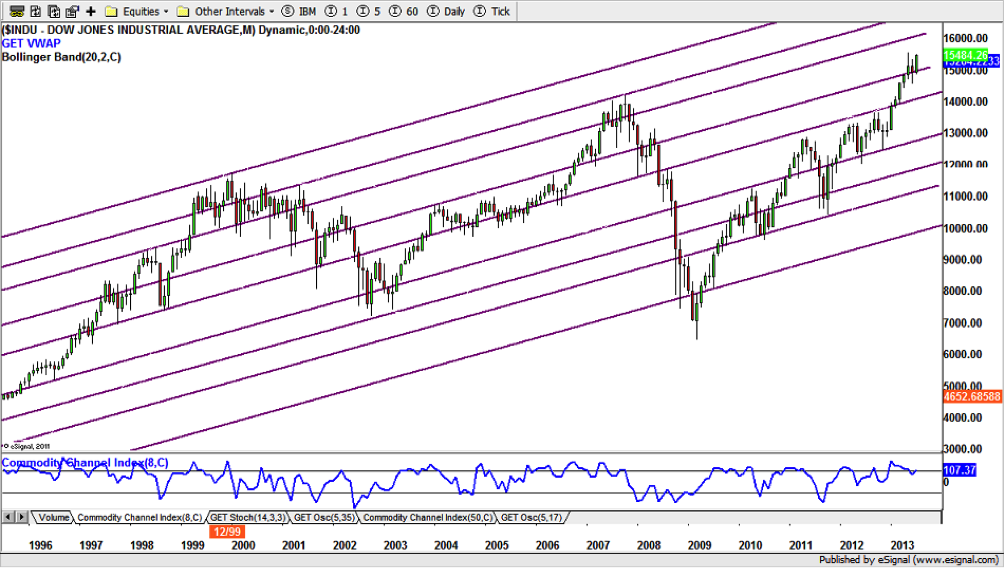
A possible roadmap from 2013 to 2016 can be derived by the following chart of the Dow Jones Industrial Average, monthly chart, just with few trend lines:
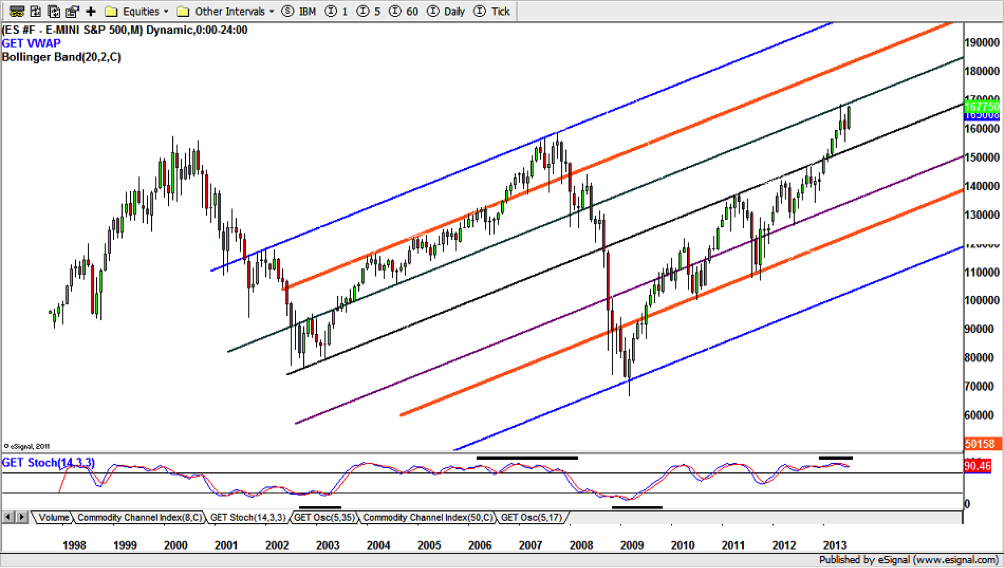
The same can be seen on the Sp500 monthly chart:
From the 2016 low then, the Dow should start a final set of five waves which will bring the index to new historical highs by 2022 to a level which could be around the 20,000 points.
Similar to equities, also interest rates have cycles and here you can clearly see their cycles in history:
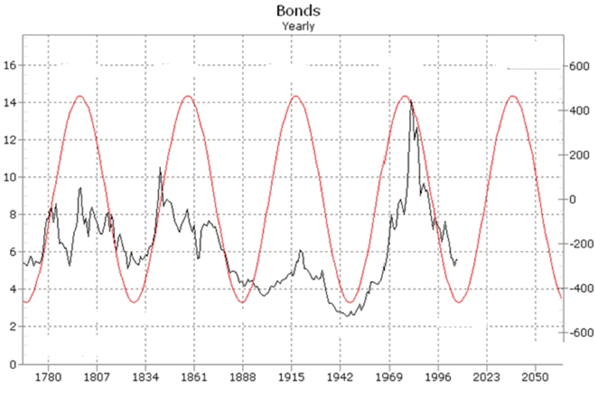
What this chart above shows you (and I am afraid it is not updated to 2013) is that we are now at the bottom of a 40 year bull market in bonds, which probably will turn to a new multi-year bearish trend very soon.
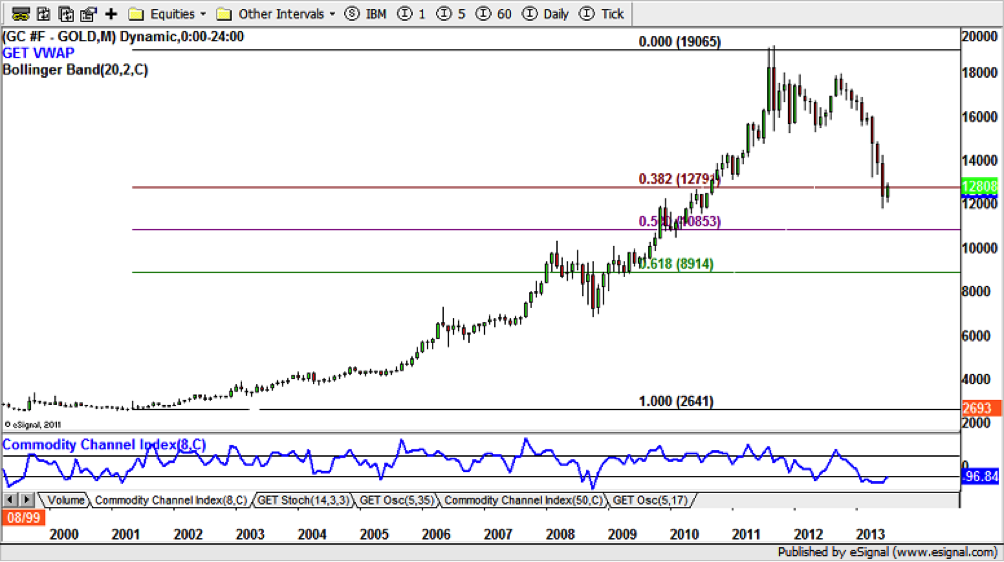
In this secular outlook another important instrument is Gold (GC) that below is plotted on its monthly chart: having a bigger perspective, and the monthly chart does the job, it is easy to notice that the recent bearish movement is a mere 38.2% retracement which still holds confirmation that Gold is inserted in a secular bull phase. At this stage it is expected to achieve at least a double top at 1900 usd/once but from this chart I suspect that the previous high may very well be violated during the next bull phase.
If the above outlook will be confirmed, then many other consequences from 2022 and onwards will be possible in human, financial and geopolitical aspects.